Altarea’s Special Features
Altarea operates as a hybrid entity with two primary businesses, both centrally financed within the group. It employs a comprehensive consolidated approach, particularly in its LTV and ND/EBITDA metrics (refer to our Worth Knowing section on this).
Credit Rating
Altarea holds a BBB- credit rating and has issued a €300m bond in 2024 with a 5.5% yield, currently trading at 5.2% as of March 2025. This investment-grade status is supported by a “credit oriented” LTV ratio of 28% according to the company’s methodology.
Debt Structure, Maturities, and Hedging
The €1.4bn bond debt constitutes half of the €2.8bn gross cash debt at the end of 2024 (including €0.2bn hybrid debt, excluding IFRS 16). The group’s debt is well-hedged. Following asset disposals and a significant reduction in working capital in the Residential Development segment, Altarea has effectively invested excess cash, generating financial income and strengthening FFO in 2024, with potential continuation into 2025-26. This is reflected in the net cost of debt at 1.9% in 2024, significantly below current market conditions.
This advantage may become thinner as refinancing progresses, influenced by credit spreads and market conditions. In summary, FFO is well-protected for the coming years, though uncertainties remain towards the decade’s end. This is a common issue among property companies and not specific to Altarea.
We believe Altarea manages its debt maturities and hedges more effectively than some major competitors, providing more time and flexibility for adaptation. The €350m capital increase at the end of 2021 exemplifies this. Altarea holds a competitive advantage relative to the market average, except against more capitalised competitors like K&B, which can leverage their resources more aggressively.
€1.0bn of gross debt is attributed to bank financing of various maturities, and €0.15bn to associates loan. Gradual refinancing is expected, including Altareit (€350m, yield 2.88% by June 2025) and Altarea (€450m in 2028 yielding 1.88%, plus €350m mortgage debt on Cap 3000 in Nice). Despite quality hedges, we anticipate net financial expenses will impact consolidated FFO.
We foresee no refinancing or liquidity risk for Altarea, but a risk of persistently higher debt costs affecting free cash flow generation.
Superior Skills
The €350m capital increase in 2021, anticipating the Primonial acquisition, significantly strengthened Altarea’s balance sheet. This capital was valuable during the residential development market turnaround in 2022. Whether by chance or strategic foresight, this move was successful in risk management, akin to strategies observed in logistics models like Segro and WDP.
The 2021 capital increase extended debt maturity and enhanced hedging effectiveness, protecting FFO. This advantage may decrease if short term interest rates fall, as seen with the current yield curve steepening. However, Altarea, like other property companies, is expected to reallocate short-term financing, now affordable due to ECB policies, to finance long-term assets.
What’s Missing
Altarea’s debt presentation is from a credit perspective, focusing on lenders and bondholders. We lack detailed information to assess shareholder-level ratios, such as EBITDA, net debt, and LTV to EPRA standards. While we understand Altarea’s balance sheet structure, precise diagnosis relative to peers is challenging due to the company’s methodology. Altarea’s benchmarks have been consistent since its 2004 IPO, well-integrated by credit rating agencies and the bond market.
Cross-Checks
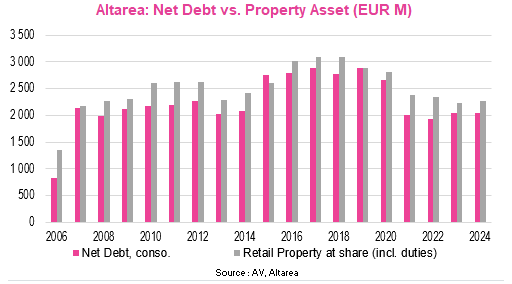
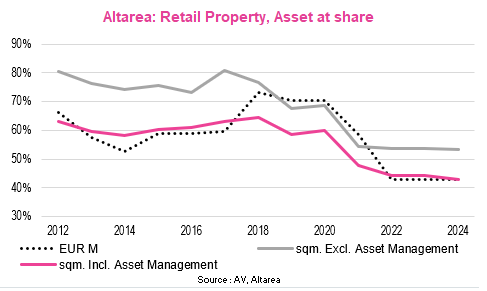
We estimate three-quarters of consolidated cash debt, or €1.5bn, is attributable to Altarea’s shareholder, implying minimal net debt for minority shareholders. Assuming a hypothetical complete sale of Retail Property, the real estate development segment would be net cash.
This suggests Altarea’s current market cap of €2.5bn values the development division at approximately €2bn EV for a recurring EBITDA of €80m in 2024. This valuation may align with the Development segment potentially returning to an EBITDA closer to €200m in the medium term, driven by a robust market recovery.
Asset Arbitrage and Risk Management
Altarea appears to manage asset risk effectively, as evidenced by regular asset disposals, capital increases, etc. Management seems to have reduced the group’s risk level and debt dependence, reflected in its dividend policy. We infer two conclusions: a reassessment of the cycle’s risk level in both businesses and/or preparation for a significant industrial transaction. We believe the risk level remains too high for a major transaction, favouring continued operations within the current scope.
Dividend
Since 2006, Altarea has maintained a 75% payout ratio of recurring FFO, leaving 25% to cover non-recurring expenses and manage debt, especially during growth phases. Management has prioritised yield, adapting by reducing dividends per share (€11.0-12.8 paid between 2016 and 2019, €10 promised in early 2023, €8 payable in 2024-2026). Core shareholders have opted for a 75% share-based payment. Since its IPO, Altarea has paid €2.4bn in dividends, with a NAV of €2.3bn at the end of 2024. The current payout ratio exceeds Altarea’s distribution capacity (see Valuation section on this).
As noted for all property companies, the French REIT regulation requiring profit distribution is incompatible with long-term portfolio development (see Worth Knowing section on this), risking impoverishment. Companies that thrive are those capable of raising capital or whose shareholders can forgo cash dividends to reduce debt and support balance sheet recovery or portfolio growth.