Pros
- Un produit unique protégé par de nombreux brevets de longue durée.
- Le marché adressable est "illimité" grâce au grand nombre de Nouvelles Entités Thérapeutiques que le groupe pourrait envisager (plus de 200 comparé aux 4 actuellement en développement).
- Le potentiel de croissance est énorme pour Crossject, avec peu de véritable concurrence sur le concept "sans aiguille".
Cons
- Le groupe n'a toujours pas de revenus.
- Le développement de Crossject est ralenti par des retards dans les processus de production/enregistrement tandis que la communication du groupe n'est pas optimale.
| | |
|
12/24A
|
12/25A
|
12/26E
|
12/27E
|
12/28E
|
|
PER ajusté (x)
| | |
-8,63
|
-8,67
|
9,79
|
6,47
|
3,04
|
|
Rendement net (%)
| | |
0,00
|
0,00
|
0,00
|
0,00
|
0,00
|
|
VE/EBITDA(R) (x)
| | |
-17,8
|
-19,9
|
3,84
|
2,32
|
1,01
|
|
BPA ajusté (€)
| | |
-0,30
|
-0,21
|
0,19
|
0,29
|
0,62
|
|
Croissance des BPA (%)
| | |
n/a
|
n/a
|
n/a
|
51,2
|
113
|
|
Dividende net (€)
| | |
0,00
|
0,00
|
0,00
|
0,00
|
0,00
|
|
Chiffre d'affaires (M€)
| | |
13,3
|
14,9
|
49,2
|
70,4
|
120
|
|
Marge d'EBIT (%)
| | |
0,00
|
0,00
|
100
|
100
|
100
|
|
Résultat net pdg (M€)
| | |
-12,8
|
-10,4
|
11,9
|
20,4
|
43,4
|
|
ROE (après impôts) (%)
| | |
322
|
275
|
51,2
|
32,8
|
45,9
|
|
Taux d'endettement (%)
| | |
|
|
3,86
|
-25,8
|
-29,3
|
|
|
|
Potentiel
214 %
Cours (€)
1,88
Capi (M€)
121
|
|
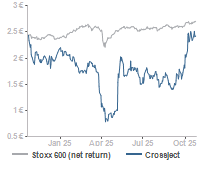
Perf. 1S:
|
-2,60 %
|
|
Perf. 1M:
|
-16,6 %
|
|
Perf. 3M:
|
-11,9 %
|
|
Perf Ytd:
|
-14,3 %
|
|
Perf. relative/stoxx600 10j:
|
-4,48 %
|
|
Perf. relative/stoxx600 20j:
|
-20,8 %
|
|